Where Older Foster Youth Are Given Housing, and Why It Matters
When young people leave foster care, where do they end up? This project puts the answer on the map.


Every year, hundreds of young people in New York City transition out of foster care, and where they land can play a major role in how they fare in life from that point on. A select few—those who demonstrate they have nowhere else to live, go through a psychiatric evaluation, and are lucky enough to land one of the open spots (assuming there are open spots)—end up in supportive housing provided by the city. These housing units are a litmus test for how New York City provides for some of its most vulnerable charges: foster youth can only qualify for them if they can demonstrate that they have no other safety net whatsoever. Rather than being strategic investments in a young person’s growth, stability, and dignity, these placements are often last-resort solutions reserved only for those who have exhausted every other option.
Very little is publicly known or reported about the quality and location of these supportive housing units, let alone the effectiveness of this placement program in setting young people’s lives off on a positive trajectory. In response, this multifaceted project, a combination of policy report and data visualization, sets out to change that: it represents the first time that supportive housing for foster youth in New York City has been systematically mapped, analyzed, and evaluated.
This project attempts to answer the following questions:
- Where do youth in supportive housing in New York City live?
- What characterizes the buildings and the types of neighborhoods where they live?
- Why are they predominantly placed in these areas?
The project addresses these questions by mapping the locations of supportive housing for youth across New York City and then analyzing the data and what they reveal about the environments foster youth are placed in—and the potential risks or challenges associated with those conditions. (Because there are no supportive housing units for this population in Staten Island, this report excludes that borough in “citywide” data.) As we will see, the picture these data paint is not a pretty one. Some of the key findings that you will take away from this analysis include the following:
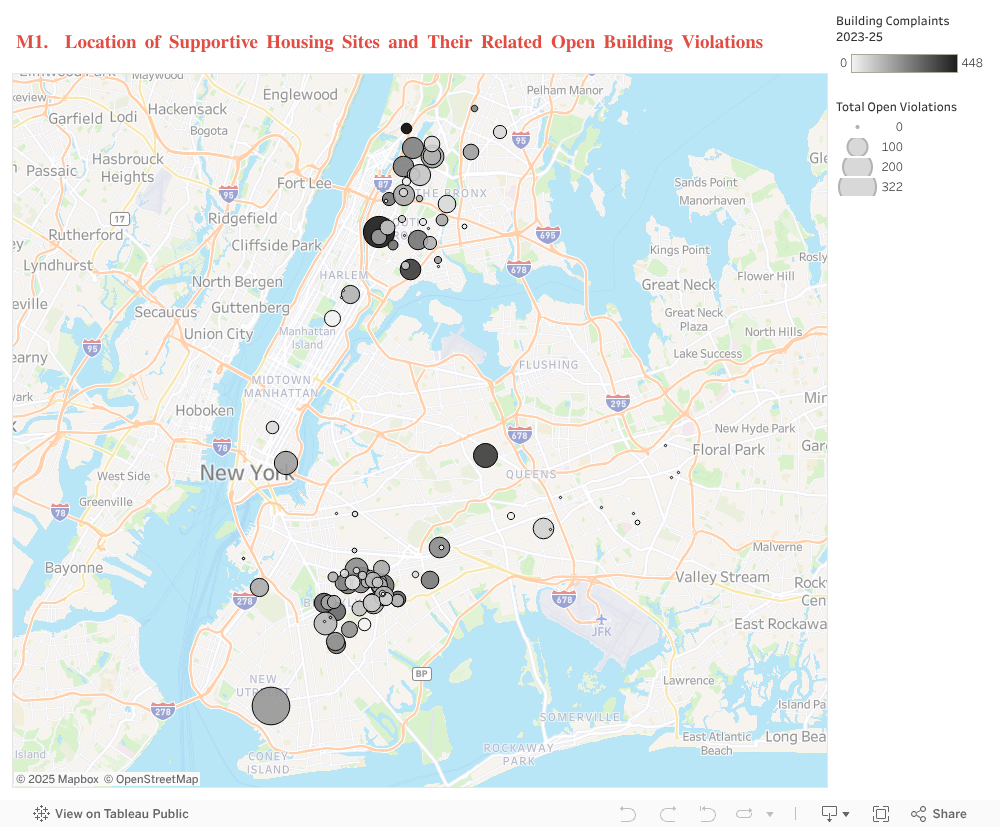
- According to the New York City Department of Housing Preservation and Development, the average number of building complaints in the 112 buildings analyzed is 115 complaints per site in the past two years, with an average of 46 open violations per building still unresolved as of October 2 2025. The highest number in a single building reached an astounding 448 complaints in the past two years and 322 open violations.
- For police precincts where supportive housing buildings are located, there is an average of 32 rapes, 274 robberies, and 592 felony assaults reported per year.
- According to police department data from December 2024, citywide averages per precinct were the following: 24 rapes, 224 robberies, and 384 felony assaults. That means the areas where foster youth are placed have higher average numbers of rapes, robberies, and felony assault rates, showing consistently more violence than what’s typical across New York City.
- According to American Community Survey (ACS) data, over half (52.2 percent) of supportive housing for foster youth is located in high-poverty census tracts, with 9 percent in areas of extreme poverty (≥40 percent). On average, these tracts have a poverty rate of 24 percent—well above the 16 percent citywide average.
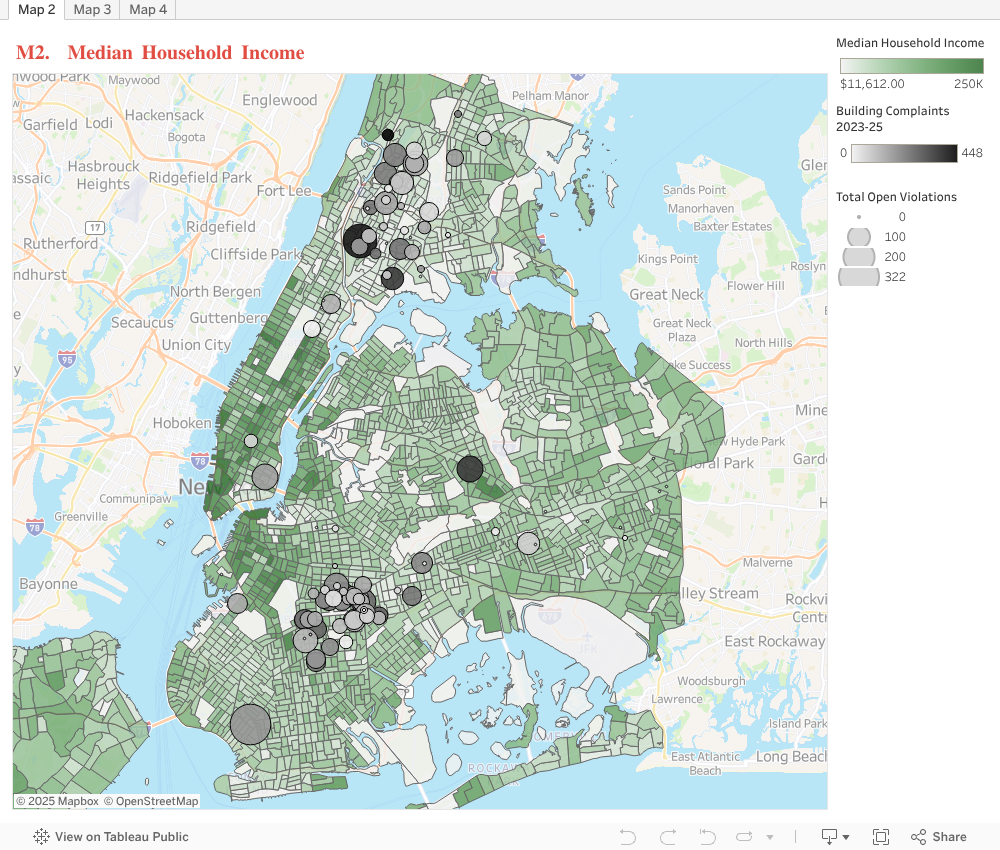
- According to ACS data, youth in supportive housing are, on average, placed in census tracts with an average area median income that is $18,000 less than that of the census tracts where their peers across New York City live.
If we know that where you live shapes your safety, opportunity, and future, why are foster youth—already among our most vulnerable—being systematically placed in the neighborhoods with the highest poverty, most dangerous conditions, and buildings in disrepair?
What Is Supportive Housing for Foster Youth, and How Do Young People End Up There?
Street corners teeming with rats and roaches. Hallways that reek of the acrid stench of urine. Blocks that are so unsafe that delivery drivers refuse to approach. The pungent smells of drug smoke and overflowing garbage bins. From East New York in Brooklyn to Hunts Point in the South Bronx, the picture is painfully familiar for far too many people, including the former foster youth who call these conditions home. And as this research demonstrates, all too often, these are the sort of neighborhoods where young adults who have aged out of foster care find themselves if they have to rely on the city for housing. But before we examine the data, it’s important to understand what supportive housing actually is—and how youth aging out of care end up there in the first place.
Supportive housing is a form of publicly provided affordable housing that pairs a stable, “long-term” place to live with supportive services to help residents maintain housing and work toward personal goals. Here, “long-term” generally refers to housing expected to last several years, distinguishing it from short-term options like shelters or halfway houses, though it still may not provide the permanence most people associate with stable housing. Supportive housing is typically offered to individuals who face barriers to housing stability, such as youth aging out of foster care, people with disabilities, or those experiencing homelessness.
Supportive housing can take different forms:
- Scattered-site placements are individual apartments located throughout the community, in which tenants live independently and receive support services through regular visits or at nearby offices.
- Congregate-care placements are more centralized, with multiple residents living in the same building or facility and often receiving on-site support services, such as case management.
As this report demonstrates, all too often, the sites selected for New York City’s supportive housing units are in under-resourced neighborhoods and lower-quality buildings. It is important to note that the substandard conditions for many of these housing units are almost never because of any specific malicious actor or individual decision; to the contrary, most of the people who work in child welfare try to do so with the best of intentions (especially considering the limited amount of housing options available to youth who are aging out of care). Instead, a combination of city, state, and federal policies that govern supportive housing for youth who have aged out of foster care result in creating poor housing options for some of the most vulnerable people in society.
These youth who are aging out of foster care entered into these welfare systems in the first place through no fault of their own. They were removed from their homes by the city, placed into foster care settings that can be unstable or traumatic, and were frequently discharged with as little or less than they had when they started—without permanent housing, family reunification, or long-term support. They end up back in the same types of under-resourced neighborhoods and facilities from which they were removed, older, but as disconnected and unsupported as ever.
This cycle of displacement and return compounds trauma and limits opportunities for healing and advancement. If the goal is to provide a true foundation for independence and stability, then youth aging out of care must have access to high-quality housing in neighborhoods that are safe, resourced, and supportive—not those already abandoned to disinvestment and oversight. As the research demonstrates, young people aging out of foster care yearn for stability and opportunities for upward mobility. Where you live is one of the most important factors in determining whether such aspirations are possible. In New York City, of the 429 youth who aged out of foster care in 2022, 31 percent had to stay in a foster or group home because they simply had no other housing options. And while the remaining 69 percent were afforded housing, most of those options left them in neighborhoods saddled with the legacy of redlining.
How the Sample Group and Data Categories Were Selected
To better understand the patterns of where supportive housing exists and the impact of these placements on young people, I undertook the task of mapping all supportive housing locations where young adults who have aged out of care are located in New York City for which I could access reliable data, including scattered site units and congregate buildings. These made a total of 112 distinct buildings. Each building has at least one unit (and often many more than one unit, with one specific building, for example, housing forty youth aging out of care), meaning that the present study considers the conditions of likely hundreds of youth being served in supportive housing programs.
Using this information, I then contextualized these housing units within three major data types: building safety, public safety (violent crime data in particular), poverty, and area median income (AMI). For building safety, this report uses a combination of foster youth testimony and New York City Housing Preservation and Development (HPD) building violations data. For public safety, I use data on the prevalence of violent crime, as reported by the New York City Police Department (NYPD) and broken down by police precinct. Finally, I retrieved average median income (AMI) numbers from the U.S. Census and the American Community Survey (ACS). Further details can be found in the appendix.
Building Safety and Integrity: The Appalling Level of Building Violations at Supportive Housing Sites
Using data from the New York City Department of Housing Preservation and Development (HPD) website, I examined the conditions of the buildings themselves, and uncovered a concerning prevalence of open violations pertaining to the locations where former foster youth are placed. An open violation means that HPD not only has a housing code violation on file for the building, but that also the issue has yet to be resolved. The average number of building violations in the 112 buildings analyzed is 46 open violations per building, with the highest number in a single building reaching an astounding 322 open violations.1 This particular building has had 172 complaints in the last two years, representing 52 potential class A violations, 186 potential class B violations, and 84 potential class C violations. This building also has 14 overdue lead violations pending. These violations often include serious issues such as mold, infestations, and power outages, which create unsafe and unhealthy living environments for the people these buildings are supposed to serve, former foster youth included.
These violations often include serious issues such as mold, infestations, and power outages, which create unsafe and unhealthy living environments for the people these buildings are supposed to serve, former foster youth included.
HPD maintains an open database on housing violations across the city. Because the number of units in a given building vary widely, it’s difficult to establish a single, consistent point of comparison. Still, the sheer volume of violations in supportive housing buildings used for former foster youth’s supportive housing speaks for itself—and reveals an unacceptably low standard for where young people aging out of care are being placed.
One example is a building in the Bronx that has had 409 complaints in the last two years, and which currently holds 226 open violations—39 Class A, 103 Class B, and 84 Class C violations; this building also includes 8 overdue lead paint violations according to HPD records. Class A violations are considered non-hazardous and typically include issues like minor leaks, broken fixtures, or missing required signage. Class B violations are more serious and are considered hazardous, covering conditions such as mold, roach or rodent infestations, and inadequate lighting. Class C violations are the most severe, often involving immediately dangerous conditions like no heat or hot water, lead paint hazards, or structural instability.
For a single building housing young people transitioning out of foster care, this number of violations—particularly the 187 total Class B and C violations—is deeply alarming. It signals chronic neglect and unsafe living conditions that can put already-vulnerable youth at even greater risk, both physically and emotionally. No one—especially those trying to gain stability after aging out of care—should be expected to live in such an environment.
Another example is in Queens, which currently has 130 open violations: 36 Class A, 73 Class B, and 21 Class C. These numbers point to widespread, ongoing issues in the building.
In addition to the violations, this building has had 347 complaints filed in the past two years, underscoring persistent tenant concerns and likely unresolved problems. This level of disrepair is unacceptable, for anyone, and especially for youth aging out of care. It reflects not just neglect by the landlord, but also a failure in oversight by the systems meant to ensure safe, stable housing for some of New York City’s most vulnerable residents.
Of the 112 supportive housing buildings for youth aging out of foster care, 33 buildings are in the Bronx and 56 are in Brooklyn—together making up nearly 80 percent of all supportive housing sites for this population. To understand the safety of these placements, I compared the crime rates in the neighborhoods where supportive housing is located to the overall borough-wide averages.
Bronx (33 buildings; supportive housing vs. borough average)
- Rapes: 38 vs. 37 → +3.8% higher
- Robberies: 432 vs. 413 → +4.5% higher
- Felony assaults: 731 vs. 698 → +4.7% higher
Takeaway: Supportive housing in the Bronx is located in areas with crime levels comparatively higher than the borough-wide averages, meaning youth are disproportionately exposed to more violence than the average Bronx resident.
Brooklyn (56 buildings; supportive housing vs. borough average)
Rapes: 38 vs. 24 → +54% higher
Robberies: 326 vs. 181 → +80% higher
Felony assaults: 738 vs. 347 → +113% higher
Takeaway: In Brooklyn, the disparities are extreme. Supportive housing is overwhelmingly concentrated in neighborhoods where violent crime occurs 1.6 times to more than 2 times more often than the borough-wide average.
Taken together, these findings reveal a troubling pattern: while supportive housing in the Bronx mirrors slightly elevated crime levels, the placements in Brooklyn are concentrated in neighborhoods with dramatically higher rates of violent crime. This means foster youth are disproportionately exposed to unsafe environments in the very housing meant to support their transition into adulthood.
Remedying and Preventing Such Prevalent and Dangerous Neglect Requires an Overhaul in Oversight
These findings show that youth aging out of foster care are overwhelmingly placed into buildings with significant issues. The most dangerous violations—those that pose direct threats to health and safety—appear dozens or even hundreds of times more frequently in the buildings meant to “support” them. Class B violations like mold and vermin are more than just unpleasant—they contribute to chronic health problems. Class C violations, such as exposed lead or non-functioning smoke detectors, can be life-threatening.
Moreover, these placements cause long-term damage to basic civic trust. For young people who have already experienced trauma, displacement, and institutional neglect, placement in buildings with extreme code violations reinforces a message that their safety is not a priority. Supportive housing is meant to be a stepping stone to stability and independence. Instead, many youth are placed in buildings that fail even the most basic health and safety standards, undermining their ability to thrive.
If “supportive housing” is to mean anything, it must start with housing that is safe, clean, and worthy of the young people we say we’re supporting.
That means two things for policymakers: (1) Oversight should be scaled to where youth actually live, and (2) we can’t assume “low sample = low problem.” Instead, high violation density in a small number of supportive housing buildings may indicate intense, localized neglect. These conditions are preventable. Regular inspections tied to enforcement, transparent complaint tracking, fully funded contracts that cover real maintenance costs, and placement decisions that adequately weigh building condition—not just bed availability—need to be made basic standards of care.
Building on my previous report, I recommend implementing entry and exit surveys for each placement. These surveys should capture any issues with the unit, the quality of maintenance, and how safe youth felt in the building, as well as whether they would recommend it as a placement for other young people. Even in this small way, youth deserve to have a voice at the table. If “supportive housing” is to mean anything, it must start with housing that is safe, clean, and worthy of the young people we say we’re supporting.
The High Prevalence of Violent Crime in Neighborhoods Where Supportive Housing Is Located
To analyze violent crime rates, I used the NYC police precinct data for 2024 based on the precincts where the buildings were located and produced averages on violent crimes in particular. For police precincts where supportive housing buildings are located, there is an average of 32 rapes, 274 robberies, and 592 felony assaults per year.
According to NYPD data from December 2024, citywide averages per precinct were the following: 24 rapes, 224 robberies, and 384 felony assaults. That means the areas where foster youth are placed have higher robbery and assault rates, and consistently more violence than what’s typical across New York City. Not only are these neighborhoods below average in opportunity—they are above average in violence, and that’s where the system is sending young people transitioning to adulthood.
And for a more localized comparison, we can look at Sunnyside, a neighborhood in Queens located within the 108th Precinct. Sunnyside is an average neighborhood in the city in a number of respects. Economically, households in the neighborhood earn more than the citywide median ($97,370 versus $79,480) and face less poverty (10.1 percent versus 18.2 percent), but not to the level of the city’s wealthiest enclaves. Crime is moderate—lower than citywide averages, yet the precinct ranks in the middle for safety. Housing is mixed: rents are below those of nearby neighborhoods, and home prices, though rising, remain under the city median. Demographically, Sunnyside mirrors Queens with high diversity, an immigrant resident proportion of nearly half the population, and slightly higher college attainment than the city average. Overall, Sunnyside falls in the middle range—neither affluent nor distressed. It’s a place that many former foster youth would love to call home.
And for good reason, not least of them safety. Sunnyside reported significantly lower violent crime rates in 2024 than the averages in the neighborhoods with supportive housing placements, with one murder, 21 rapes, 228 robberies, and 263 felony assaults. The stark contrast between these numbers and the violent crime rates in precincts where supportive housing exists highlights the disproportionate placement of vulnerable youth in high-crime environments. We should not be seeing this correlation, but the opposite: the city placing some of its most vulnerable young adults in its safest environments, not its most dangerous.
It’s crucial to underscore the reality underpinning these data points: they describe daily life for young people who already carry the weight of trauma. Living in neighborhoods with high rates of violent crime means they often don’t feel safe coming home, walking to the store, or even sleeping at night. Many of the youth who I have spoken with who shared testimonies in my previous report stated that they avoided leaving their buildings at all, which limits their ability to go to work, school, or therapy appointments. Others may normalize violence or become desensitized to it, because it’s all around them. Equally tragic, these placements send an unspoken message: that their safety doesn’t matter. It tells them that after aging out of foster care, they should just be grateful for whatever they get—even if it’s a building in a neighborhood where they’re likely to get robbed, or verbally harassed as they walk down the block.
Safety as a Foundation: Maslow’s Hierarchy of Needs
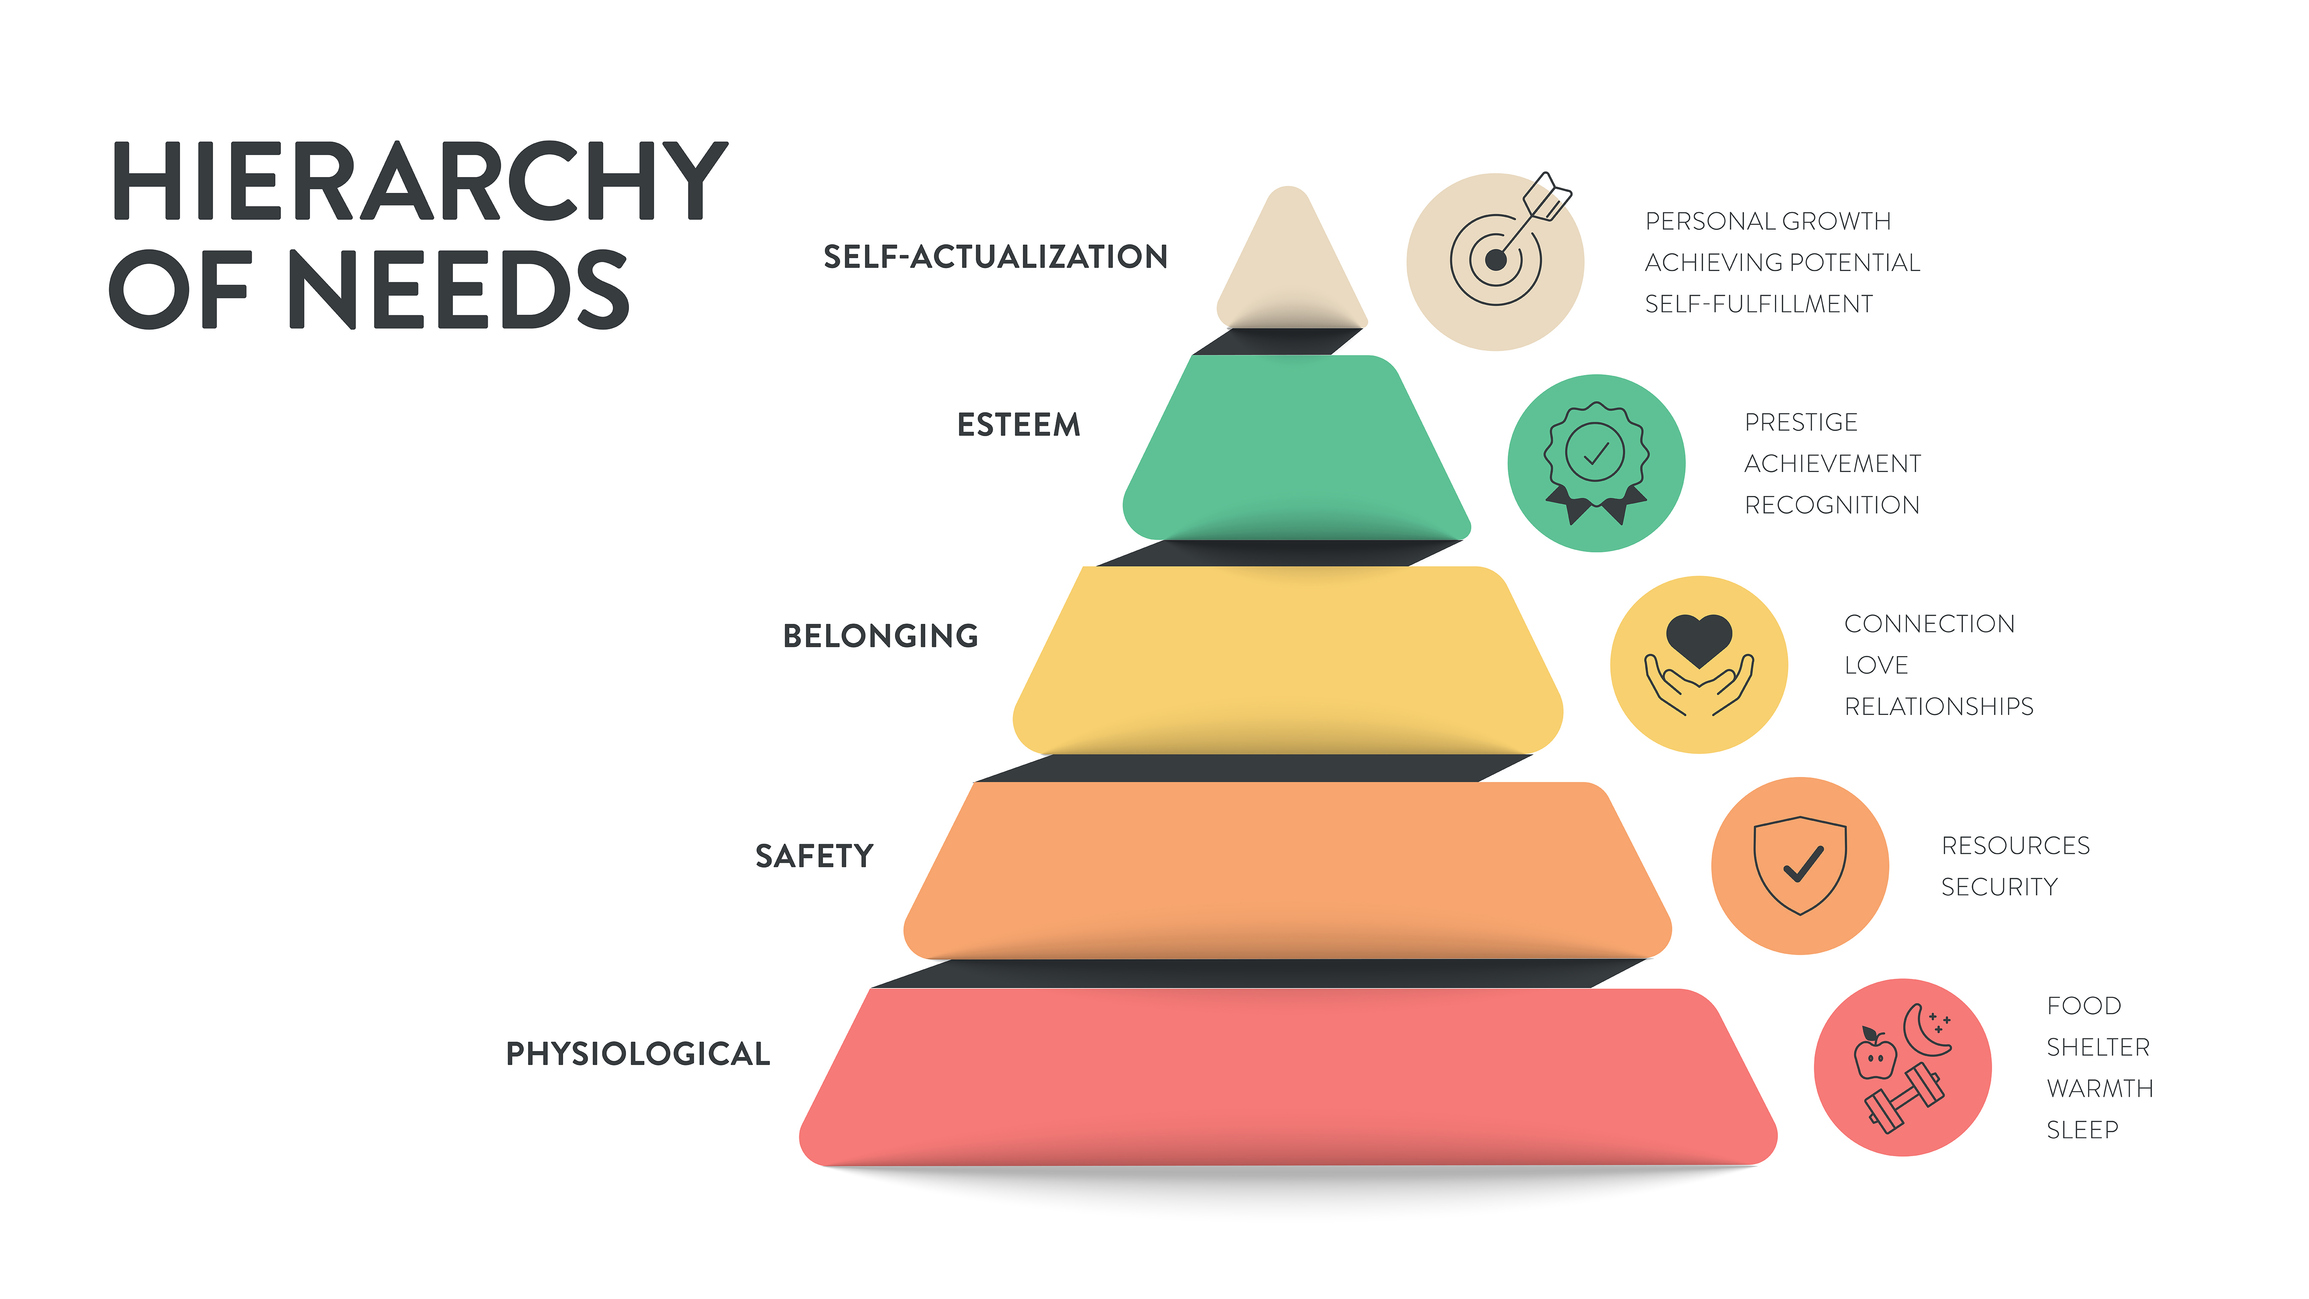
To better understand the harms caused by living in an unsafe environment, it’s worth revisiting psychologist Abraham Maslow’s Hierarchy of Needs. According to this well-established framework, safety is one of the most fundamental requirements for human development and well-being. In his pyramid-shaped model, basic physiological needs like food and water come first, followed immediately by the need for safety—both physical and emotional. This includes stable shelter, protection from harm, and a sense of security in one’s environment. Without these foundations, a person cannot focus on higher-level needs such as belonging, self-esteem, or self-actualization.
For youth aging out of foster care and placed into supportive housing, this theory helps us understand the cost of the neglect that they endure. When a young person is living in a building with dozens of open Class B and C violations—conditions like mold, broken locks, infestations, or lack of heat—and must traverse streets to and from home where violence is likely, they are trapped in survival mode. Instead of being able to focus on college, work, mental health, or long-term goals, they are forced to navigate daily threats to their well-being.
Simply put, you can’t reach your full potential when you’re worried about whether the ceiling will leak, the heat will turn on, or the hallway is safe to walk through at night.
Simply put, you can’t reach your full potential when you’re worried about whether the ceiling will leak, the heat will turn on, or the hallway is safe to walk through at night. If we expect young people to thrive, especially those transitioning from foster care, we must start by giving them the thing Maslow says they need before thriving is even possible: safety.
Incomes Are Lower and Poverty Levels Are Higher in Neighborhoods with Supportive Housing than the Rest of the City
The data reveal that the vast majority of supportive housing units—both in general and specifically for youth aging out of care—are concentrated in high-poverty census tracts. City administrators often cite cost as the primary reason for these placement patterns;2 be that as it may, the costs saved by the city do not justify the costs incurred by those who endure these placements. It’s important to clarify that when this report links the placement of foster youth in high-poverty neighborhoods with worse outcomes, the implication is not that the people who live in those communities produce worse outcomes. Rather, it’s about the systemic disinvestment that has historically occurred—and continues to occur—in areas with concentrated poverty. These neighborhoods often lack access to well-funded schools, reliable transportation, quality housing, and economic opportunities. The result is an environment where basic resources and services are limited—not because of the residents, but because of long-standing policy choices that target those residents.
Concentrated poverty creates concentrated need. When large numbers of people face economic hardship in the same area, the systems meant to support them—whether schools, housing, or health care—are more likely to be overwhelmed and under-resourced. This makes it harder for young people, including those aging out of foster care, to thrive. Highlighting these conditions is not a judgment of poor communities: it’s a call to address the structural barriers that make certain neighborhoods fundamentally harder to succeed in. The goal is to shed light on how placement decisions—such as where supportive housing is located—can either perpetuate cycles of disadvantage or help disrupt them. In that sense, while these data do not describe the direct experiences of the subject population, they do broaden our sense of the depth of the disinvestment that these neighborhoods suffer and raise an urgent question: why are foster youth repeatedly funneled into neighborhoods shaped by systemic neglect?
William Julius Wilson’s analysis of concentrated poverty offers a powerful framework for understanding how we got here. He describes how decades of federal disinvestment in cities—especially during the Reagan administration—combined with the loss of manufacturing jobs and the rise of low-wage, unstable service work to create deeply impoverished, segregated urban neighborhoods. These neighborhoods, often in the Northeast and Midwest, were hit hardest by budget cuts to mass transit, job training, public works, and other critical services. Wilson shows that even policies not explicitly about race—like cuts to general revenue sharing or the relocation of industry to the suburbs—have disproportionately harmed low-income Black communities.
Today, these are the very same areas where foster youth are often placed into supportive housing: Neighborhoods with high unemployment, crumbling infrastructure, poor schools, few services, and little access to opportunity.
Today, these are the very same areas where foster youth are often placed into supportive housing: Neighborhoods with high unemployment, crumbling infrastructure, poor schools, few services, and little access to opportunity. Wilson also introduces the concept of “spatial mismatch,” in which the jobs that do exist are located far from the people who need them most. He notes that these neglected and disinvested neighborhoods are often defined by abandoned buildings, vacant lots, and a lack of basic amenities like grocery stores or banks. Wilson’s work reminds us that concentrated poverty is not simply the result of personal failure or individual behavior. It is the legacy of political and economic choices—choices that have led to the placement of some of our most vulnerable youth in environments that limit, rather than expand, their futures. Understanding these connections is critical if we want to create housing policies that truly support foster youth in building stable, thriving lives.
Application to Supportive Housing Data
The U.S. Department of Commerce offers the following to define its Official Poverty Measure (OPM):
“High poverty” is defined as an areawide poverty rate of 20 percent or more. Changes in poverty concentrations falling between 20 percent (high poverty) and 40 percent (extreme poverty) have the greatest marginal impact on individual well-being. The 20 percent threshold is also highly correlated with poverty areas identified by multi-factor measures of economic hardship, such as the Appalachian Regional Commission’s county economic classification system, which highlight a range of disparities residents may face. As such, a high poverty measure can be used to identify areas where poverty has reached a critical impact point—where neighborhood poverty begins to negatively affect individual well-being regardless of a person’s own poverty status—and as a proxy for the potential extent of that impact, with rates approaching 40 percent indicating conditions that are more structurally and demographically systemic.
In my analysis of census tracts containing supportive housing for foster youth, 52.2 percent are located in high-poverty areas, meeting or exceeding the U.S. Census Bureau’s threshold. Within this, 9 percent are in neighborhoods that meet the “extreme poverty” threshold of 40 percent or more. On average, the poverty rate for census tracts where supportive housing is located is 24 percent—substantially higher than the 16-percent average across all census tracts in New York City. These figures underscore that more than half of supportive housing placements are in neighborhoods where poverty has reached levels shown to have measurable negative impacts on residents’ well-being.
Figure 1
Area Median Income Helps to Attribute the Real Costs of Living in New York City
Cost of living must also be taken into consideration. Because the U.S. Census Bureau’s poverty rate calculations cover the entire state of New York, they do not fully reflect the significantly higher cost of living in New York City. To address this, I have also analyzed area median income (AMI) data, which provides a more nuanced understanding of affordability and economic hardship in the context of New York City’s housing market.
While AMI is a standard benchmark used in housing policy, it doesn’t always capture the full picture on its own—especially for youth in supportive housing. According to the U.S. Census Bureau, poverty status is determined based on a set of income thresholds that vary by family size and composition. The data used in this analysis reflect the percentage of individuals within each census tract who fall below the federal poverty line, offering a clear snapshot of localized economic hardship across the neighborhoods where supportive housing is located.
Poverty rates, in contrast with AMI, measure the percentage of people in a specific census tract living below the federal poverty line. AMI therefore presents a more localized and human-centered facet of the economic realities of a community. For foster youth, who often face structural disadvantages even before aging out of care, the surrounding neighborhood context can either support or undermine their efforts to transition into adulthood. Analyzing poverty rates alongside AMI provides a clearer picture of how placements may replicate broader patterns of inequality.
AMI is a benchmark set each year by the U.S. Department of Housing and Urban Development (HUD) and used by New York City’s Housing Preservation and Development (HPD). It represents the midpoint income for a given area—meaning half of households earn more, and half earn less. Using AMI is helpful in this project’s analysis because it provides a standardized way to assess economic status across different census tracts, neighborhoods, or populations in the same metro area. It allows us to clearly define what counts as low-income or very low-income in New York City, and to understand how the census tracts where foster youth are placed compared to citywide norms.
In addition to citywide measures, we examined both one-earner households and all households within supportive housing census tracts, given that the vast majority of youth in supportive housing live in single-person, one-earner households. This breakdown makes it possible to more accurately reflect the income realities of the population most directly impacted. These trends are reinforced by broader income measures:
- The median household (all households) AMI for all census tracts in NYC is $80,466.50
- The mean household (all households) AMI for all census tracts in NYC is $86,939
- The mean one-earner household AMI for all census tracts in NYC is $74,276
- The median one-earner household AMI for all census tracts in NYC is $63,182
In contrast, the neighborhoods where supportive housing is located fall far below these citywide norms:
- The median household (all households) AMI for all census tracts in supportive housing tracts is $57,236: ~28.9% less
- The mean household (all households) AMI for all census tracts in supportive housing tracts is $61,518: ~29.2% less
- The mean income for one-earner families in supportive housing tracts is just $55,964: ~24.7% less
- The median income one-earner families in supportive housing tracts is $50,147: ~20.6% less
The median represents the midpoint—half of households earn more and half earn less—while the mean is the mathematical average across all households. When the mean is significantly higher than the median, as it is here, it often indicates that a small number of very high-income earners are skewing the average upward, masking the true economic conditions experienced by most people. Across the board, households in supportive housing tracts earn 20–30 percent less than NYC averages, whether you look at all households or just one-earner households. This reinforces the argument that young people aging out of foster care are being clustered in some of the city’s most economically disadvantaged areas, rather than in neighborhoods with broader opportunity.
In order to better get a sense for what these AMIs mean in context, we can use the categories that NYC HPD sets for low-income status, which is based on percentage of AMI, as follows:
Extremely Low-Income and Very Low-Income: 0–50 percent of AMI
Low-Income: 51–80 percent of AMI
The following tables spell out the results.
That means youth in supportive housing are, on average, placed in census tracts with an average AMI $18,000 less in annual income than the census tracts where their peers across New York City live.
This disparity holds true even when disaggregated by borough:
- In the Bronx, the mean one-earner family AMI for all census tracts with supportive housing is $44,010, while the average one-earner household AMI in Bronx households is $53,633.
- In Brooklyn, the average one-earner family AMI for all census tracts with supportive housing is $62,631, while the average for one-earners in Brooklyn generally is $75,362.
- In Queens, the average one-earner family AMI for all census tracts with supportive housing is $47,269, while the average one-earner household AMI in the Queens census tracts generally earn $56,502.
- In Manhattan, the mean one-earner family AMI for all census tracts with supportive housing is $38,052 for one-earner households, while the average one-earner household in Manhattan earns $106,859.
Why Is Supportive Housing Located in Such Disadvantageous Areas?
Supportive housing units are often concentrated in specific neighborhoods due to a mix of historical, economic, and systemic factors that prioritize affordability over opportunity. These neighborhoods typically have lower property values, making it financially easier for non-profit organizations to secure housing at below-market rates, and making them more viable under current public funding guidelines. However, this concentration is not purely about cost-efficiency—it reflects a deeper policy decision. It’s not just that the developments are always “below market”—rather, government agencies cap how much can be spent on land acquisition, which effectively excludes higher-income neighborhoods from consideration. But this, too, is a policy choice—one that consistently places youth aging out of foster care in disinvested neighborhoods while cutting them off from the transportation and safety that higher-opportunity areas provide. In effect, the very systems meant to support these young people too often reinforce the barriers they were placed into care to escape. Funding restrictions and cost caps don’t just shape where housing is built—they dictate who gets access to safe environments and who doesn’t.
The very systems meant to support these young people too often reinforce the barriers they were placed into care to escape.
Compounding this issue are the city’s own land use and zoning processes. In New York City, zoning laws and land use policies—particularly the Uniform Land Use Review Procedure (ULURP)—can limit where such housing is developed. While ULURP allows for community engagement in land use decisions, it also enables low-density, higher-income neighborhoods to resist changes through organized opposition, often reinforcing exclusionary practices. This resistance is further amplified by “Not In My Backyard” (NIMBY) sentiment, particularly in wealthier areas, and reflects broader societal stigmas around foster youth and marginalized communities.
Promisingly, initiatives like City of Yes seek to counteract these barriers by encouraging increased housing density citywide, though they don’t fully address the placement disparities. As a result, supportive housing remains disproportionately located in neighborhoods already struggling with systemic neglect—effectively reinforcing cycles of poverty and limiting the potential for youth exiting care to thrive. To break these patterns, policymakers must not only reform funding guidelines but also confront the zoning and social barriers that prevent equitable distribution of supportive housing. To achieve equity and opportunity, placement patterns must be reexamined and reoriented toward environments that foster growth, access, and long-term success.
What Is the Impact of Such Negative Environmental Conditions on Young People?
The physical and emotional toll of these conditions further compounds the struggles of the former foster youth living in supportive housing. Daily exposure to violence, fear, and trauma is not something one can simply shrug off, even if you’re used to it: it corrodes the foundations of psychological well-being. For those already carrying the weight of instability, abandonment, and systems involvement, living in squalid apartments and neighborhoods with high rates of violent crime compounds their trauma and creates a state of chronic hypervigilance. This makes it incredibly difficult to focus on long-term goals like employment, education, or healing—because survival becomes the priority.
The environments where many foster youth are placed after aging out are not just under-resourced—they’re actively harmful. The prevalence of building violations is a clear marker of systemic neglect: mold that triggers asthma, broken locks that invite intrusions, heat outages in the dead of winter. These aren’t minor inconveniences. They’re daily reminders that even after navigating the foster care system, these young people are still being placed in conditions that communicate: you don’t matter enough to be safe, warm, or clean.
These aren’t minor inconveniences. They’re daily reminders that even after navigating the foster care system, these young people are still being placed in conditions that communicate: you don’t matter enough to be safe, warm, or clean.
The emotional toll of this neglect is profound. Living in spaces that are visibly deteriorated reinforces internalized narratives of worthlessness. It tells young people that the world expects them to tolerate more, aim lower, and stay small. And over time, that messaging limits not just their quality of life, but their aspirations. When policy decisions isolate youth in environments defined by risk and neglect, the long-term effects are not just measurable—they are deeply personal.
Foster youth deserve to live in well-maintained housing that prioritizes tenant well-being and provides a foundation for success. Unfortunately, many are placed in buildings with persistent violations, reflecting a lack of care and investment. The neglect of these communities does not just affect their present circumstances—it casts a long shadow over their futures, reinforcing cycles of inequity and limiting their ability to break free from systemic barriers. Ensuring access to safe, high-quality housing means more than just a roof over their heads—it means placing youth in buildings where repairs are handled promptly, basic services are reliable, and landlords are actively accountable to city standards and tenant concerns. It also means locating housing in neighborhoods where youth can walk to school, work, or the grocery store without fear—communities with functioning streetlights, community resources, and a sense of safety and opportunity.
Responsible housing placement is not just a policy detail. It’s a crucial step toward improving youth outcomes and giving foster youth a real chance to thrive.
Questions for Future Research and Analysis
The report’s findings raise a whole new set of questions related to funding and policy:
- What would it take, politically and financially, to create more supportive housing units in high-opportunity areas?
- Who are the decisionmakers who can influence the quality of housing for young people who age out of care?
- Should young people aging out of care have priority status in securing housing?
This mapping project is designed to help spark these conversations, and these questions need to be taken with all seriousness. The data analyzed here all represent real lives, real risks, real outcomes, and real consequences.
One step in the right direction is worth mentioning—a policy that acknowledges the urgent need for transparency and accountability. Intro 1245-A, recently passed by the New York City Council and sponsored by Speaker Adrienne Adams, amends an existing reporting law to require that data on foster youth in supportive housing be disaggregated by both age and City Council district.
This is more than just a technical fix: it’s a meaningful shift in how we track, understand, analyze and ultimately respond to where foster youth are being placed. By knowing exactly which neighborhoods and council districts these young people are funneled into, we can better identify patterns of concentrated poverty, unsafe conditions, and systemic neglect. It also allows advocates, elected officials, and communities to demand improvements—not just in the number of placements, but in the quality and location of those placements.
In a system where too much has gone untracked for too long, this kind of disaggregated data is a necessary first step. It lays the groundwork for more informed decision-making, stronger oversight, and policies that prioritize safety, dignity, and opportunity. Transparency alone won’t fix the conditions foster youth are facing—but without it, change remains out of reach.
Appendix A: Methodology
This project represents the first systematic attempt to map and analyze supportive housing placements for youth who have aged out of foster care in New York City. The methodology was designed to combine multiple data sources, public records, government databases, and youth testimony into a single picture of where foster youth live, and the conditions of those neighborhoods and buildings.
1. Identifying Supportive Housing Sites
The starting point was building a list of supportive housing locations that serve youth aging out of foster care. This included both scattered-site apartments and congregate-care buildings. Locations were drawn from a combination, nonprofit provider lists, and program documentation, resulting in 112 distinct buildings across the four boroughs. Each building was treated as one site, regardless of the number of youth units it contained.
2. Building Conditions and Violations
To evaluate building quality, I used the New York City Department of Housing Preservation and Development (HPD) open data portal, which tracks unresolved housing code violations. For each of the 112 buildings, I recorded the total number of open violations and categorized them by severity:
- Class A (non-hazardous): minor issues such as leaks or signage.
- Class B (hazardous): mold, infestations, broken locks, inadequate lighting.
- Class C (immediately hazardous): conditions that pose imminent risks, such as no heat, lead paint, or structural instability.
Because building sizes vary, comparisons are made using absolute counts rather than per-unit rates. These numbers provide a conservative picture of building safety, as they reflect only violations officially logged and still unresolved.
3. Crime and Public Safety
Neighborhood safety was assessed using 2024 NYPD borough and crime data, aggregated at the precinct level. For each precinct containing supportive housing, I calculated average annual counts of four major violent crimes: murder, rape, robbery, and felony assault. These averages were then compared to citywide per-precinct averages for the same year, as well as to one benchmark neighborhood (Sunnyside, Queens, 108th Precinct), selected because it represents a middle-income, moderately safe NYC community. While precincts are larger than census tracts, they provide a consistent geographic proxy for local safety conditions.
4. Poverty and Area Median Income (AMI)
To understand the socioeconomic context of supportive housing placements, I used the American Community Survey (ACS) 2019–2023 five-year estimates and HUD Area Median Income (AMI) figures for New York City. Poverty rates were calculated at the census tract level, with “high poverty” defined as ≥ 20 percent and “extreme poverty” defined as ≥40 percent, following federal thresholds. In addition, AMI data was analyzed both for all households and for one-earner households, since most youth in supportive housing live alone. These figures were compared against citywide medians to highlight disparities between supportive housing tracts and the broader NYC population.
5. Youth Testimony and Lived Experience
Quantitative data was supplemented with qualitative accounts gathered from foster youth who have lived in supportive housing. Their experiences of building neglect, neighborhood safety, and the impact on daily life provided essential context for the numbers. While these accounts are not statistical measures, they are vital in grounding the data in lived reality and demonstrating the human consequences of policy decisions.
6. Limitations
There are several limitations to this methodology. Precinct-level crime data cannot capture block-level variation and may over- or under-estimate the immediate environment of a building. HPD violations only reflect conditions officially reported and recorded, meaning undocumented hazards are not captured. Census and ACS data, while the best available, are estimates that may not fully reflect current neighborhood conditions. Despite these constraints, the combination of multiple sources building violations, crime, poverty, AMI, and youth testimony creates a robust and credible picture of the environments where foster youth are placed.
7. Purpose of This Approach
The goal of this methodology is not only to document where supportive housing exists, but to situate these placements within the broader social and physical conditions that shape opportunity. By layering building, safety, and income data onto a map of supportive housing sites, this project makes visible what has long been hidden: the environments into which New York City’s most vulnerable young people are funneled at the moment they transition to independence.
Appendix B: How to Use This Interactive Map
The first page of the map allows you to visualize three key variables layered on top of each other:
- Building Violation of each census tract
- Crime data
- Poverty rate of each census tract in New York City
By displaying these variables together, the map helps highlight patterns across neighborhoods.
What is a Census Tract?
Census tracts are small geographic units, making them particularly useful for understanding localized disparities. Because they provide a more granular view than larger districts or boroughs, you can see how conditions in specific areas compared to the rest of New York City. This allows for a clearer, more precise understanding of neighborhood-level inequalities.
Supportive Housing Placements
The dots on the map represent placements of supportive housing for youth who have aged out of the foster care system (covering all NY/NY III and NY 15/15 placements). When you hover over a dot, you’ll see key contextual information about the building and its surroundings, including:
- The total number of building complaints recorded from 2023–2025
- The number of currently open violations
- Type of crime that is recorded in the police precinct in the area
- Poverty rate and area median income by census tracts
Violent Crime Data
While most variables on the map are presented at the census tract level, crime data is included at the precinct level due to public data availability. Each supportive housing placement is linked to its corresponding NYPD precinct, where users can view average annual rates of key crimes such as murder, rape, robbery, felony assault, and burglary. Although precincts are broader than census tracts, this data provides critical context about the safety of the neighborhoods where foster youth are placed.
Analyzing crime data is essential because safety plays a fundamental role in youth development and stability. High-crime environments can heighten trauma, increase vulnerability, and create additional barriers for young people who are already navigating the challenges of aging out of foster care. By incorporating crime statistics, the map highlights how systemic placement patterns can expose youth to environments that may compromise their mental health, physical safety, and long-term outcomes.